Converting Data Into Analytics
We are undoubtedly living in the age of abundant and ubiquitous data. Humans have been saying that “knowledge is power” for ages, but the statement is ever more relevant now. Simply, companies and people who can wield data more effectively will win out. Others—businesses that simply open stores and wait for customers to come in—will lose out. A jetfighter with superior radar technology will beat the unlucky opponent with ease: It is not just a matter of weaponry, when one side wouldn’t even know what hit them. The ability to manipulate and see through data provides that kind of superpower.
A few years back, there was a lot of hype about “Big Data”. Many acted like just having mounds of data would create business opportunities. But did it? Was it really about the three V’s that everyone talked about then? If a user has enormously large amounts of data (the first V, for “volume”), and it moves around really fast (the second V, for “velocity”), and if there are many unique pieces of data (the third V, for “variety”), will the user somehow reap benefits from that? Let’s just say that I haven’t met anyone who made a lot of money by just maintaining huge databases measured in quintillions of bytes.
Expecting raw data to yield value would be like waiting for raw elements to become usable products automatically. Wheat isn’t flour, and flour isn’t bread. Steel is not a car, and gold is not a wristwatch. Similarly, raw data is not usable information.
Data must go through rigorous data refinement processes—automatically or manually, by machines or by humans—to
yield insights that can lead to meaningful actions.
Let’s face it: most decision makers, executives, or marketers do not have the skill set required to harness the value out of mounds of data on their own. Giving them the key to a storage place of unrefined data isn’t any different from providing them with raw materials without even a blueprint and telling them to build an office building.
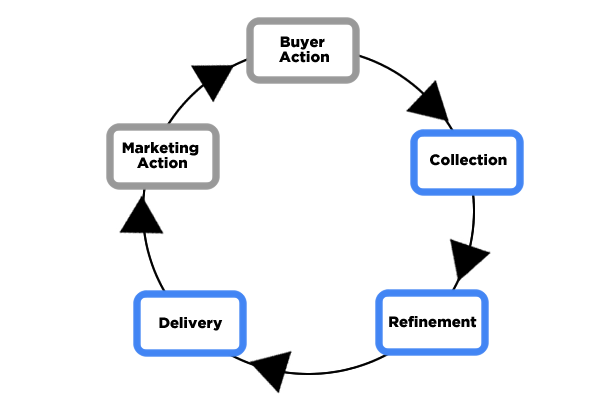
Data players—commonly called data scientists or analysts—must actively convert data into insights with a clear understanding of the business at stake. And such a process certainly doesn’t stop at collecting and storing exabytes of data in some cloud.
To reap benefits from data, data players must excel in:
- Collection
- Refinement
- Delivery
Neglecting even one part of these key steps will lead to missed opportunities, or worse, a meltdown of the data value chain. In the end, all data activities must yield business value; otherwise, even what they call state-of-the-art data tool sets remain expensive toys for a bunch of data geeks.
Data Collection
Obviously, you can’t start data mining without usable data. Collected data must be stored securely—regardless of its volume, velocity, or variety—and such data should be easily retrieved when needed.
Depending on the types of data and transaction channels, even the simplest data collection can be challenging. Certainly, when transactions happen online, we know who bought what, when, and for how much. But how do you maintain a similar level of data collection for retail stores? It surely wouldn’t be free. Such a commitment is not just about data or analytics, but becomes a business decision. Retail customers won’t share their personally identifiable data without explicit benefits, and that translates to a collection cost.
Even for online activities, collecting data about who is clicking away on a certain shopping site
before the buyer commits to purchase or to share her identity isn’t that simple. Why do you think that even the most advanced kind of digital report stops at opens, clicks, and conversions, short of individual buyer-level metrics? It is because it is really difficult to collect PII (personally identifiable information) for everyone on every occasion through every channel.
Therefore, even the simplest data collection request must be part of a data strategy stemming from clear business objectives. Collecting data for the sake of collection is definitely not ideal, as it will increase the size of databases without much added benefit.
Now, if the goal is just to keep records of everything, you could stop the activity right here. Thanks to advancements in data technology, massive storage and rapid data retrieval, along with basic data dashboards on collected data, are the norm in the data ecosystem nowadays.

However, modern marketers and decision makers must aim higher, and data players must see beyond obvious use cases. If you have dealt with any reputable online retailer, you can simply click your account history and trace every item you’ve ever purchased from them. Such fast retrieval and thorough data collection is the result of some serious investment in data technology.
Why is it, then, that their promotional messages to you don’t seem to be relevant to your needs most of the time? Why do we, as consumers, feel that most promotions directed at us are generic messages? As businesspeople, why is it so difficult for us to obtain an accurate and consistent set of measurement metrics across channels, divisions, and toolsets? Why is it still very difficult and costly to act based on data?
It is because advanced use of data requires much more than initial investment in data collection, storage, and retrieval. All those fancy Big Data tools—or even data in more approachable Data Lakes—are just a good beginning, as none of those contain drinkable water yet. To yield value, data must go through multiple layers of data refinement.
Data Refinement
Big Data became big as analysts expanded their horizons with improvements in data technology and started calling unstructured and unrefined free-form data “usable.” And with advanced data and analytics tools, most of that data is indeed usable. Who imagined that a machine would be able to tell the mood of a person based on one picture? The boundaries of data mining are being shattered every day.
But that doesn’t mean that we can just use raw data for analytics and decision-making. One may say that machines will take care of it all one day, if not already. Yes, that is one way to use machines: just throw raw data in there and see what happens. That may just work. But then again, maybe not.
Even machines prefer clean and organized data, yielding more accurate and consistent predictions (if that is the intended goal). Well-designed machine learning processes would include separate modules for proper data hygiene, standardization, categorization, and consolidation. Such data preparation work calls for different modules beyond machine learning designed for prediction, for example, and the steps cannot and should not be skipped over.
If living and breathing analysts are involved in the process, the stakes are even higher. It is common knowledge in the analytics community that most data scientists spend over 80% of their valuable time on basic data hygiene (because most data is dirty), standardization (because most data is not consistent even for the most basic values), categorization (because most data elements are in free form and not well-organized), consolidation (because most data sets are scattered all over the place without clear ways to merge them properly), and summarization (because most data is on a transaction or event level as originally collected, not on a customer level or other levels required for decision-making).
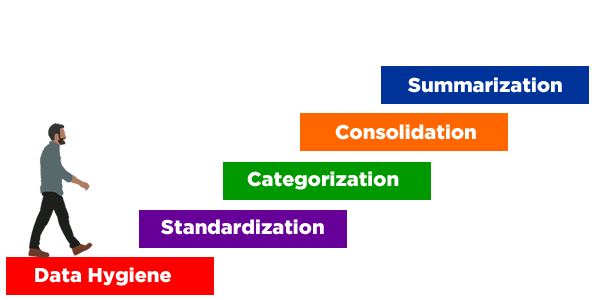
These activities may sound basic, but yes, that is how analysts with fancy titles spend the majority of their time: fixing data all day long. This type of lopsided workload is so common among analysts that one of the prerequisites of being a data scientist is data manipulation skills, not just knowledge of modeling and reporting techniques.
Conversely, if the data is well-organized, accurate, consistent, consolidated, and up-to-date, analytics activities will be expedited by a factor of ten at least. I have been involved in cases where a four-week timeline for a rather common modeling practice was cut down to a same day turnaround, all thanks to proper data refinement processes.
Further, I would insist that advanced analytics, such as statistical modeling, are extensions of data refinement processes. Even a data set that is in decent shape in terms of recency, accuracy, and consistency will never be complete by any measure. Even with the most rigorous data collection procedures, there is simply no way to know everything about everyone. In terms of missing values (or unknown data), most databases have more holes than Swiss cheese.
Advanced analytics helps fill in such gaps. And that is definitely good for decision makers. We may never know for sure if it will rain this afternoon. But we all
trust—to a degree—the weather forecast each morning, and this is a perfect example of predictive analytics. We will never know for sure, but we take chances with predictions such as “70% chance of afternoon showers” and even plan our day accordingly.
Predictive techniques are also helpful in filling in the gaps left by unknowns. We will never know every household’s income level with certainty, or someone’s tendency to be a foreign traveler or a luxury shopper, or their characteristics as a buyer, investor, or a voter. But when data is wielded properly, we can get to a proxy for such things. Even if the models are built by machines, the premise of prediction and the notion of approximation do not change. As a result of modeling, we can act based on high probabilities of being correct.
As you can see, the journey to “usable” information involves various types of techniques. I lump them together as “data refinement” without remorse, as some organizations skip this important step entirely.
I will talk about analytics in more detail later in the series, but the important takeaway at this point is that no decision maker—or even analyst—should routinely be exposed to the complexity of having to deal with raw data.
Delivery
Data and intelligence provide no value if not used for decision-making, ultimately producing monetary benefits for businesses. Even the most recent “clean” pieces of data—the result of refinement processes—cannot be employed properly if they are not
delivered to the right user at the right time.
Luckily for users, there are many toolsets that can connect them with data: dashboards or business intelligence reports, drill-down and query tools for somewhat advanced users, campaign targeting and management tools, and various applications for personalization. These tools put refined data and derived intelligence into the hands of decision makers and help them digest the information and determine their next actions and, in turn, send targeted and customized messages to consumers and prospects.
You can say that the rubber finally meets the road at this stage. The only caution is that these tools, no matter how fancy they may look or what types of advanced analytics are claimed to have been included, are not to be seen as a substitute for proper data refinement processes. I have seen too many sad endings caused by such misuse of toolsets.
Even if a toolset has
some ability to dissect data, do not forget that these reporting or campaign tools get overloaded easily, and they do not automatically fix all bad and dirty data. Buying an expensive campaign toolset and putting raw data though it would be like putting crude oil into a brand-new sports car. You just don’t do that, and if you do, you don’t blame the toolset when the machine breaks down (though you may blame the salesperson who overpromised the toolset’s capabilities).
For instance, so many so-called “fully-automated email campaign engines” that claim to provide campaign analytics with a feedback loop to improve future campaigns are often limited to really basic open-and-click data. Good luck building any real response model using such rudimentary pieces of data. That is a sad reality when full transaction and combinations of promotion and response data could have been used for this prediction, if proper data refinement processes had been in place.
No one toolset can cover the entire spectrum of data collection, refinement, and delivery. Some tools may venture into neighboring areas (e.g., some campaign tools may have built-in modeling and segmentation engines), but it will be difficult to find a tool that is good at everything at a professional level.
Even if most of these steps were done by machines, multiple modules would be employed, all precisely tuned for specific duties. In other words, there is no one “magic bullet” for all these steps, at least not yet. So, even a casual user of information must be aware of the basic journey of data to harness its maximum value.
Various Types of Analytics
Analytics is the key to insights and the basis for all data-based activities. All data hygiene and consolidation processes are essentially to get the data ready for subsequent analytical work. Without proper analytics, all the collected data would be wasted, and business decisions would get degraded to the level of gut feelings and wild guesses, a real shame in the age of abundant data, when incremental revenue is within reach if available data is exploited even at a barely adequate level.
The world of data analytics isn’t free from obstacles, nor are related activities simple or easy. Then again, mining precious metals isn’t easy either, but people figure out ways to get to them, even if the ore is on the moon. Data mining isn’t any different, and analytics is here to stay. It is definitely not just another buzzword in the industry. Someone has to make sense of the data that is being piled on at a phenomenal rate every second.
“Analytics” is one of the most popular words in business today, and as a result, one of the most misused terms as well. Depending on whom you ask for its definition, you may get widely different answers. And none of them would be wrong either, as it has many sides to it.
In the interest of getting the term straight up front, allow me to break it down to four basic areas: BI Reporting, Descriptive Analytics, Predictive Analytics, and Optimization.
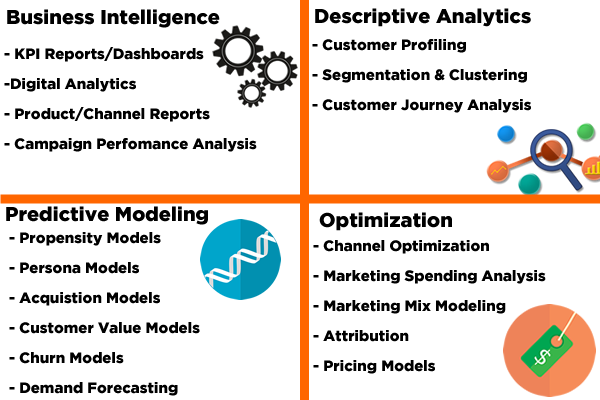
BI Reporting: Turning Data Into Actionable Insights
Business Intelligence reporting is the most common form of analytics. Decision makers want to know what is happening in their world, and various types of dashboards and digital reports serve that purpose. Once they’ve gotten used to them, users may feel totally blind without their favorite reports, much like having to drive a car without a dashboard. Can you drive a car like that? Sure you can, if you have to. But you won’t know how fast you’re going, or how much gas you have left, not to mention how many more miles you can go with the gas in the tank at the current speed.
Such real-time (or even near real-time) reports are very addictive for marketers, who must tweak their digital marketing strategy and tactics all the time. And you may find a football-field-full of vendors for digital analytics at marketing or analytics conferences. All that digital reporting, campaign analytics, and product or channel level reporting fall under this category of analytics.
BI reporting is great as a diagnostic tool. How is the campaign going? What is the best day of the week or time of the day for specific product offers? What segment is winning, and by what dollar amount? What are the trends in important metrics like clicks, conversions, and generated revenue amount by week, month, and compared to the same period last year? How many brand-new customers showed up this quarter? And is that trend going up? How about their values? Didn’t we just give away 20% discount like candy to attract them?
Marketers can easily get lost in a series of reports. I say they get “lost,” because when users find areas for improvement or signs of trouble in their businesses, they must consider other types of analytics to solve real or perceived problems. In other words, these snapshot reports are good for defining problem statements, but solving them calls for more advanced types of analytics.
For example, if you see that you have an alarming number of “one and done” customers, you will need to dig deeper to find out how multi-buyers are different from them, and develop a campaign strategy to bring them back to shop more. If you find a big pocket of customers who are fading away, you may need to predict the attrition point for each to win them back.
This is like when you are lost on the road, and simply looking at the dashboard won’t get you out of trouble. You will need to turn on a navigator, which is an entirely different type of analytics.
Descriptive Analytics: Insights Into Your Customers
Descriptive analytics examines the customers behind the actions. What do they look like and what are they about? Where are they? And what are they into?
Customer profiling, for example, provides descriptions of customers in terms of their demographic data—such as income, age, number of children, owner/renter, home value, housing type, occupation, various lifestyle indicators, etc.—and points out how specific targets differ from others. If data is available, of course we can apply behavioral data to make the profiling more colorful. For business customers, firmographic data such as industry, employee size, annual sales volume, years in business, etc. would be used, but the basic premise of the analytics is similar to that of consumer profiling.
Going deeper, the majority of marketers often venture into segmentation, which is an extension of descriptive analytics. Many segments in use out there are just rule-based—hopefully based on some profile reports at the minimum—but more serious application calls for clustering by statistically-trained analysts.
I must point out that, too often, rule-based segments turn out to be ineffective. When surrounded by hundreds or even thousands of data points, human imagination and gut feelings aren’t enough to produce relevant and functional groups. Rule-based segments are often based on two or three basic variables, and such things are often hit-or-miss. Conversely, clusters or models are the result of rigorous examination of hundreds of data variables, resulting in much more accurate and stable segment groups.
Descriptive analytics are useful, as it serves as a common language among executives, marketers, agencies, vendors, and data players. Profiles and segments provide descriptors of targets as if we are looking at them, so marketers can set up messaging strategies for each group and copywriters can write customized messages more effectively.
Some may even use basic segmentation as a targeting tool as well. It is not the most effective way to perform individual level targeting, but segments definitely serve a purpose as an entry-level targeting mechanism. (I will go into this subject in much greater depth in the future).
In any case, descriptive analytics are still part of “snapshot” analytics, based on present day data. Breaking into future prediction calls for yet another type of analytics.
Predictive Analytics: Predicting Your Customer’s Future Behavior
Some say that predictive analytics are the pinnacle of analytics. If one looks at the picture from a purely technical perspective, such a statement is not completely false. And yes, there are many factors to consider when jumping into the prediction business. But for users, predictive analytics makes things easier and simpler, because the results of predictive analytics—such as model scores—are in the form of answers to questions.
How many units of a certain product line will sell in the coming season? Who will be more likely to respond to discount offers through email? What will their spending level be for the next few years, if not their lifetime value? Who would have affinity to purchase new cutting-edge products, and who is more likely to be a trend follower? Who is more likely to be a bargain seeker, and who will remain a loyal customer for a long time?
Answering these questions even in the form of a probability—as in “70% likely to be an early adopter”—makes decision-making so much easier. So easy that even a machine would recognize that “a high score is good, and a low score is bad” and could make decisions accordingly. And converting mounds of data into these “scores” (or model scores) is what we call predictive modeling.
The word “predictive” is at times misleading, because the same technique would be used to fill in the blanks when something is unknown. Yes, we have much richer data compared to a generation ago, but we still do not know everything about everyone. Such a gap can be filled with predictive modeling techniques, as in, “I don’t know for sure, but that person is very likely to be an early adopter of new technologies.”
Some predictive analytics are indeed about prediction, and demand forecasting is a good example of that. For supply chain management, production scheduling, marketing planning, and for related human resource management, accurate prediction of future sales—and related to that, future clicks, inquiries, conversions, units, and actual amount—can save significant cost. Accurate forecasting requires teamwork among many disparate departments and a rather complex coordination of data and efforts, but businesses commit to it when potential cost savings outweigh the cost of the prediction work. And mostly, it works out exactly that way.
Such prediction is generally on the department or product level, if not for the entire business. On the other hand, in the age of one-to-one marketing, when most channels are turning into addressable media, predictive modeling on an individual level is becoming ever more important.
Marketers have been using modeling techniques for a long time for individual or household-level targeting and messaging. Specific modeling techniques may bear different names, such as propensity model, clone model, affinity model, personas (for personalization), response model (to marketing offers), acquisition model (for prospecting), customer value model, or on the negative side, attrition or churn model. These names stem more from the stage of the customer journey in which the models are to be deployed, but the nature of the work itself is similar. For instance, one would need response models for acquisition campaigns, product affinity models for cross-sell/up-sell, and attrition models for churn prevention.
In this series, I will talk mostly about this type of one-to-one model, as modern marketing calls for properly targeting and messaging
each prospect and customer in the most personal way to win their attention in the middle of a constant bombardment of marketing offers through all imaginable channels. The idea of personalization was relevant when modeling techniques were first applied to marketing decades ago, and it is even more important in the digital age.
Channels that are easy to use are also easy to abuse, and the effectiveness of marketing campaigns only goes up when the messages and offers are about the individual buyer, not about channel, division, or products. Such relevancy is brought about only through data, and predictive analytics is the most effective mechanism for such data refinement.
Optimization: Making the Most of Your Marketing Dollars
When you say “analytics” in a marketing or media agency, most will understand it as some type of optimization based on econometrics modeling. On a strategic level, the questions are more about “How much of our client’s marketing budget should we allocate to each channel to maximize ROI?”, and not regularly about “Who is more likely to respond to this seasonal offer?”. Related to such resource allocation, questions like “Among different types of marketing efforts, what worked and by how much?” must be answered as well.
Basically, the idea is to quantify the success based on the contributing factors—even for traditionally non-traceable channels—and build intelligence to allocate resources for maximum marketing throughput more holistically. There are different names for such optimization efforts, such as channel optimization, marketing spending analysis, marketing mix modeling (also known as media mix modeling, or simply MMM), and on the opposite side, attribution modeling.
I put forecasting as part of predictive modeling because of what it does, but forecasting models are also closely related to media mix modeling and attribution, as each explains different parts of the predictive continuum. After all, how much one spends on a channel will affect the performance level of that channel (affecting forecasted values), in turn influencing attribution analysis on the backend. In this line of holistic thinking, media mix modeling is generally considered to be a top-down approach, while attribution modeling to be a bottom-up approach, all pursuing the same goal of optimal marketing efforts. Marketing is about action (by the marketer) and reaction (by consumers), so a holistic approach is called for when prediction and estimates are to be made on a strategic level.
Nonetheless, these are the most complex types of predictive modeling, ingesting various types of data on multiple levels—from specific digital activity and channel level sales data all the way up to environmental data such as economic indicators. Specialists for this type of modeling have their own ecosystem, and what they do is often called simply “analytics” in many circles.
Prescriptive Analytics?
As briefly illustrated here, analytics comes in many different shapes and flavors, requiring different types of data and yielding vastly different types of results. What all these have in common is that analytics is part of the solution to specific problems.
Analytics activities should never be initiated for the sake of just digging through data without a clear purpose. Yes, once in a while, one may stumble onto some interesting findings that way, but it is a very costly way to go about analyzing large amounts of data.
All these different types of analytics should be seen as treatment options for business problems, much like doctors consider various options to cure patients. And like doctors, experienced analysts, data scientists, or analytics consultants must be able to “prescribe” the right set of analytical options to solve issues at hand. Conversely, businesspeople must be aware of analytics service providers who always resort back to
their favorite set of options. Chances are they are more like cheap drug salespeople or one-trick ponies, and are not very interested in improving overall business performance.
Some call this type of activity “prescriptive analytics”, and put it on top of a hierarchical pyramid chart of different types of analytics. Such a chart would often put BI reporting at the bottom, descriptive analytics next, then predictive analytics, and put prescriptive analytics on top of the food chain. You must completely reject this notion.
Such a hierarchical view of analytics is like saying that a doctor cannot put a patient on a surgical table until all other cheaper and easier options are exhausted. That is exactly how a patient may perish before even getting to the table. Treatment options must be picked based on the condition of the patient, not the difficulty level of the treatment. Analytics is the same way.
Prescriptive analytics (or solutioning, as some consultants would call it) must be applied to any stage. Figuring out what is wrong, creating a goal-oriented problem statement, prioritizing necessary data works, recommending a series of analytical options, procuring resources for data and analytics activities, project-managing the whole process, examining the outcome, and presenting the results along with recommended next steps are all part of the job of a serious analytics consultant. And a good one would not follow some premade analytical roadmap, starting with easy options (for them) first. Capable analysts should be able to come up with recommendations from the simplest BI reports.
All this is to say that users of analytics must have basic knowledge of analytical options, and should not be afraid of jumping into areas with which they are not familiar or committing to processes they cannot control fully on their own.
Many folks are waiting for the day when machines will just define problems, solve them, and improve prediction performance, all automatically on their own. Soon enough, such a day will come. But machines still won’t understand illogical requests, and the business goals must be set by decision makers, unless they want to give their jobs to machines as well. Ironically enough, people who are averse to anything that is called “advanced analytics” (which is pretty much everything that I listed other than basic BI reporting) also get excited about the future of machine learning.
Machine learning is an extension of advanced analytics, and just one of many ways to perform pattern recognition and future prediction. Hands are changed from smart humans to machines with massive computing powers and AI is reaching the stage of sufficient self-learning, but the mathematical part still remains the same. Just like you wouldn’t turn on a machine and expect it to provide results, all other types of analytics should be approached the same way: assess the situation, prescribe the right solution, and then execute.
As this series continues, I will dive deeper into predictive analytics, covering how it works, how to set data up for such activity properly, how to define targets for predictive models effectively, how to deploy them in business settings, why they fail, and how to measure their effectiveness on the backend.
 However, modern marketers and decision makers must aim higher, and data players must see beyond obvious use cases. If you have dealt with any reputable online retailer, you can simply click your account history and trace every item you’ve ever purchased from them. Such fast retrieval and thorough data collection is the result of some serious investment in data technology.
Why is it, then, that their promotional messages to you don’t seem to be relevant to your needs most of the time? Why do we, as consumers, feel that most promotions directed at us are generic messages? As businesspeople, why is it so difficult for us to obtain an accurate and consistent set of measurement metrics across channels, divisions, and toolsets? Why is it still very difficult and costly to act based on data?
It is because advanced use of data requires much more than initial investment in data collection, storage, and retrieval. All those fancy Big Data tools—or even data in more approachable Data Lakes—are just a good beginning, as none of those contain drinkable water yet. To yield value, data must go through multiple layers of data refinement.
However, modern marketers and decision makers must aim higher, and data players must see beyond obvious use cases. If you have dealt with any reputable online retailer, you can simply click your account history and trace every item you’ve ever purchased from them. Such fast retrieval and thorough data collection is the result of some serious investment in data technology.
Why is it, then, that their promotional messages to you don’t seem to be relevant to your needs most of the time? Why do we, as consumers, feel that most promotions directed at us are generic messages? As businesspeople, why is it so difficult for us to obtain an accurate and consistent set of measurement metrics across channels, divisions, and toolsets? Why is it still very difficult and costly to act based on data?
It is because advanced use of data requires much more than initial investment in data collection, storage, and retrieval. All those fancy Big Data tools—or even data in more approachable Data Lakes—are just a good beginning, as none of those contain drinkable water yet. To yield value, data must go through multiple layers of data refinement.